
The Rippling Impact of Redlining
The Federal Housing Authority, established in 1934, and the GI Bill, passed in 1944, made homeownership a reality for millions of Americans. However, discriminatory lending practices such as “redlining”—a practice where banks refused to grant home-purchase loans in certain areas based on their ethnic/racial composition—denied many minorities these government-supported homeownership opportunities.
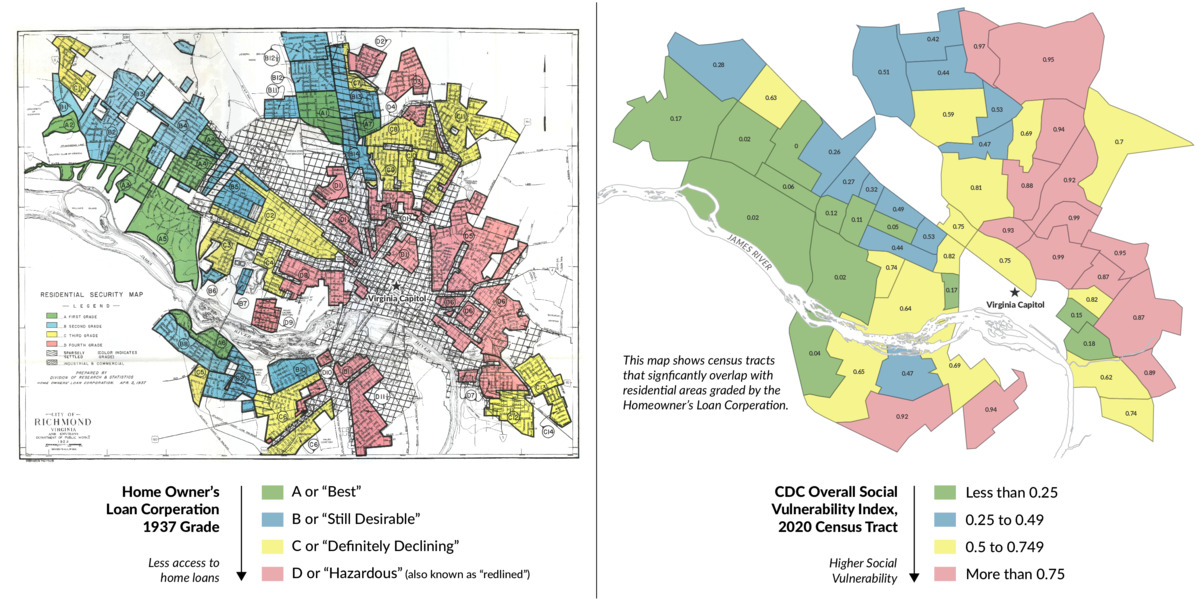
The 1930s Richmond, Virginia map on the left is an example of a federal Home Owners Loan Corporation “redlining map” grading “mortgage security” on a four-grade scale, with the red “D” neighborhoods deemed hazardous. Existing African American, Asian American, Latino or immigrant neighborhoods were far more likely to receive “D” grades or yellow “C” declining grades, which discouraged new development in those areas and drove down home values.

The effects of the discriminatory redlining practices are so pronounced that they last until this day, as evidenced by CDC’s Social Vulnerability Index (SVI) scores for the same census tracts today. The SVI combines a number of these factors: social and economic, housing and transportation, minority status and language, household composition, and disability to provide a metric of comparison between areas. Since their development in the 2000s, indices of social vulnerability have become important tools for emergency planning and public health assessment.
Today, Richmond’s health landscape reflects the contours of class and race in the city, with residents of the wealthier and Whiter west side of the city experiencing fewer health challenges and longer life expectancies than residents of neighborhoods on the east side of the city, most of which are majority African American. Similar patterns can be seen in cities across the country.
Mapping Inequality: Redlining in New Deal America
Redlining occured in thousands of communities across America. In Mapping Inequity: Redlining in New Deal America, you can explore redlining maps in cities throughout the U.S. and learn more about how redlining impacts health. To explore the maps, click on the tile below.
 |