
Red Lining Map (1930) and Social Vulnerabilities Index Map (2023)
Richmond, Virginia
Title
Red Lining Map (1930) and Social Vulnerabilities Index Map (2023)
Richmond, Virginia
Richmond, Virginia
Description
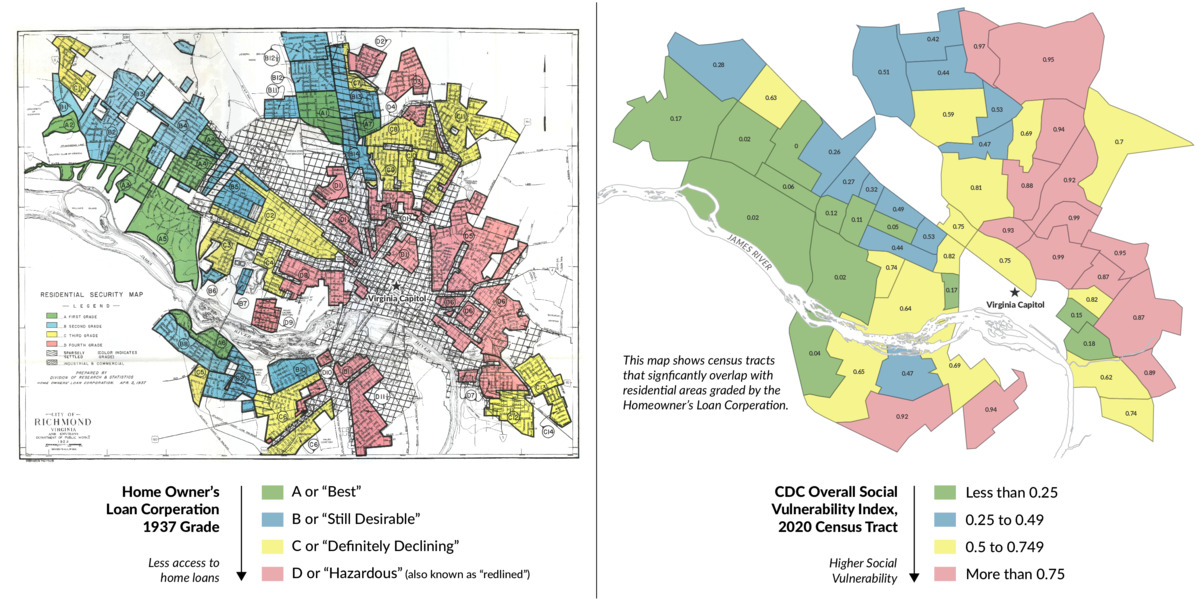
The 1930s Richmond, Virginia map on the left is an example of a federal Home Owners Loan Corporation “redlining map” grading “mortgage security’” on a four-grade scale, with the red “D” neighborhoods deemed hazardous. Existing African American, Asian American, Latino or immigrant neighborhoods were far more likely to receive “D” grades or yellow “C” declining grades which discouraged new development in those areas and drove down home values.
The effects of the discriminatory redlining practices are so pronounced that they last until this day, as evidenced by CDC’s Social Vulnerability Index (SVI) scores for the same census tracts today. The SVI combines a number of these factors: social and economic, housing and transportation, minority status and language, household composition, and disability to provide a metric of comparison between areas.
The effects of the discriminatory redlining practices are so pronounced that they last until this day, as evidenced by CDC’s Social Vulnerability Index (SVI) scores for the same census tracts today. The SVI combines a number of these factors: social and economic, housing and transportation, minority status and language, household composition, and disability to provide a metric of comparison between areas.
Creator
Digital Scholarship Lab, University of Richmond
Date
2023
Language
English
Citation
Digital Scholarship Lab, University of Richmond, “Red Lining Map (1930) and Social Vulnerabilities Index Map (2023)
Richmond, Virginia,” CDC Museum Digital Exhibits, accessed October 20, 2026, https://cdcmuseum.teachingatlanta.org/items/show/1274.
Richmond, Virginia,” CDC Museum Digital Exhibits, accessed October 20, 2026, https://cdcmuseum.teachingatlanta.org/items/show/1274.