
Browse Items (493 total)
- Collection: Health is a Human Right: Achieving Health Equity
Sort by:

Navigating Discrimination and Structural Racism

Created at the 2022 Asian American, Native Hawaiian and Pacific Islanders virtual conference, this “graphic recording” visually records discussions about the current state of health disparities research among AANHPI.
We Are More installation, Times Square, New York, 2021
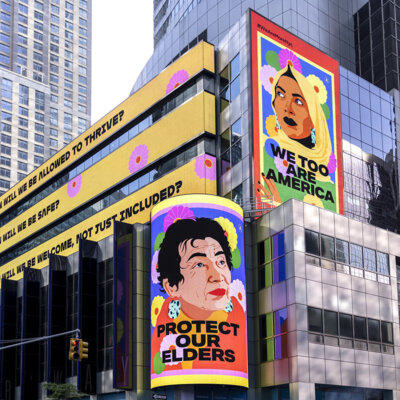
In 2021 Atlanta-raised, New York-based artist Amanda Phingbodhipakkiya launched a public art campaign in response to anti-Asian violence in New York and across the U.S., including Atlanta. To inform her We Are More campaign, Phingbodhipakkiya…
We Belong Here, 2021

In 2021 Atlanta-raised, New York-based artist Amanda Phingbodhipakkiya launched a public art campaign in response to anti-Asian violence in New York and across the U.S., including Atlanta. To inform her We Are More campaign, Phingbodhipakkiya…
Geographic distribution of structural racism in the US labor markets
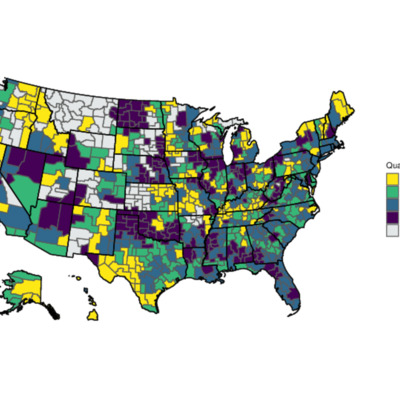
Map published in the article “Where are the Labor Markets?: Examining the Association between Structural Racism in Labor Markets and Infant Birth Weight,” Health Place, March 2023
Red Lining Map (1930) and Social Vulnerabilities Index Map (2023)
Richmond, Virginia
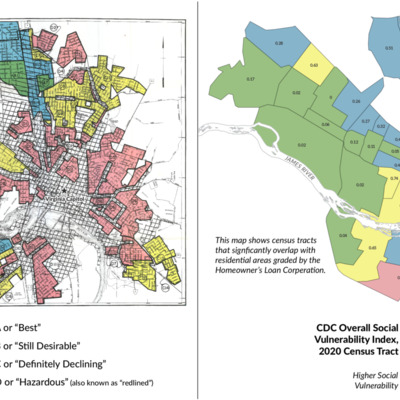
The 1930s Richmond, Virginia map on the left is an example of a federal Home Owners Loan Corporation “redlining map” grading “mortgage security’” on a four-grade scale, with the red “D” neighborhoods deemed hazardous. Existing African American, Asian…
Morbidity and Mortality Weekly Report (MMWR) Vol. 72 No. 26 June 30, 2023
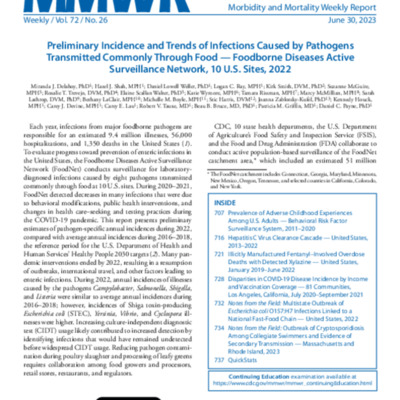
The Morbidity and Mortality Weekly Report (MMWR ) series is prepared by the Centers for Disease Control and Prevention (CDC).
Often called “the voice of CDC,” the MMWR series is the agency’s primary vehicle for scientific publication of timely,…
Often called “the voice of CDC,” the MMWR series is the agency’s primary vehicle for scientific publication of timely,…
Equity Spotlight: Boston
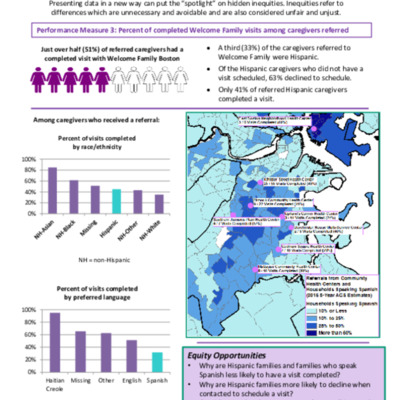
An infographic created by the Commonwealth of Massachusetts Department of Health highlighting hidden inequities based upon their gathered data from the Welcome Family Program. The Welcome Family program offers one-time home visit from a nurse for all…
Racial Equity Data Road Map
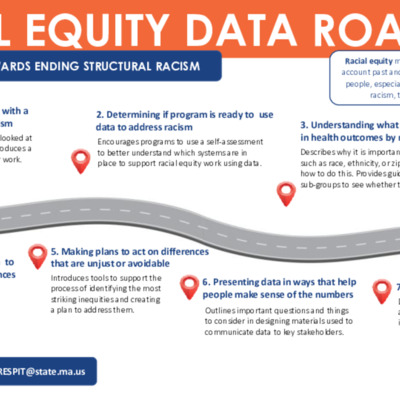
Chart used as a promotional tool by the Commonwealth of Massachusetts Department of Public Health to show how the department plans to use data to end health disparities linked to structural racism in the state.
Leading Causes of Death and Age-Adjusted Mortality Rates per 100,000 by Population Group, 2016-2019
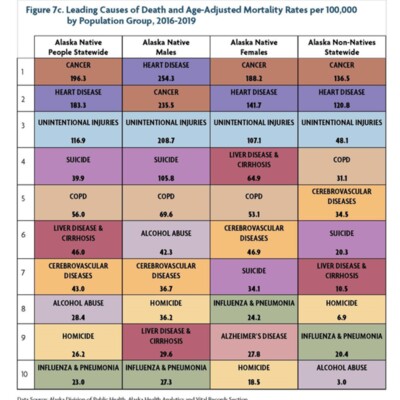
Chart from Alaska Native Health Status Report December 2021 - Third Edition. Chart describes common causes of death among Native Alakasans gahered by the Alaska Division of Public Health, Alaska Health Analytics and Vital Records Section.