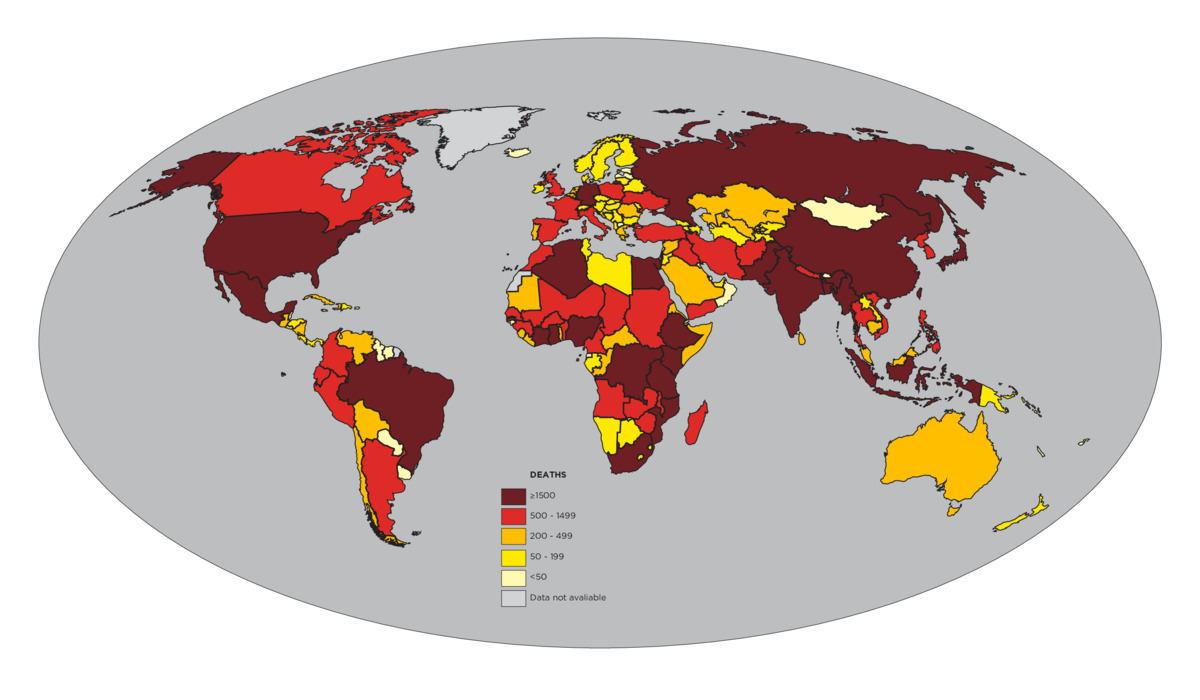
Global Mortality Graph, 2009 H1N1 Pandemic
Title
Global Mortality Graph, 2009 H1N1 Pandemic
Description
From April 2009 to August 2010, WHO requested that countries report all laboratory-confirmed deaths associated with the 2009 flu pandemic. During that period, WHO reported 18,500 laboratory confirmed deaths. This modest number has caused many to question whether the pandemic response was excessive. Laboratory-confirmed deaths tell only part of the story regarding the overall global number of deaths linked to the 2009 pandemic. After the pandemic, CDC led a study that took another look at (H1N1)pdm09 virus-associated respiratory and cardiovascular deaths and mortality rates (the number of deaths in a specific part of the population). The study estimated that there were more than 575,000 (H1N1)pdm09 virus-associated respiratory and cardiovascular deaths. This was 15 times higher than the number of laboratory-confirmed deaths reported by WHO, as reflected in the map above. The mortality rates noted that a disproportionate number of total deaths occurred in African and Southeast Asian regions
Source
CDC Influenza Division
Citation
“Global Mortality Graph, 2009 H1N1 Pandemic,” CDC Museum Digital Exhibits, accessed April 19, 2024, http://cdcmuseum.teachingatlanta.org/items/show/977.


